"More than any other time in history, mankind faces a crossroads. One path leads to despair and utter hopelessness. The other, to total extinction. Let us pray we have the wisdom to choose correctly." - Woody Allen
Milton Friedman argued in this 2003 WSJ op ed piece that though the Fed's performance for the first 70 years of its existence left a healthy dose of room for improvement, over the years since about 1986 the Fed's thermostat was honing in on a Goldilocks temperature: policy was getting just about right. I'm not sure how much I agree. I'm a believer in the nature of human history being at its core (unfortunately) repetitive, particularly when it comes to economic cycles.
As we sit in the longest run of monetary expansion in this country's history, thought it’d be interesting to offer a long view of long rates using everyone’s favorite benchmark, the 10 year Treasury Note.
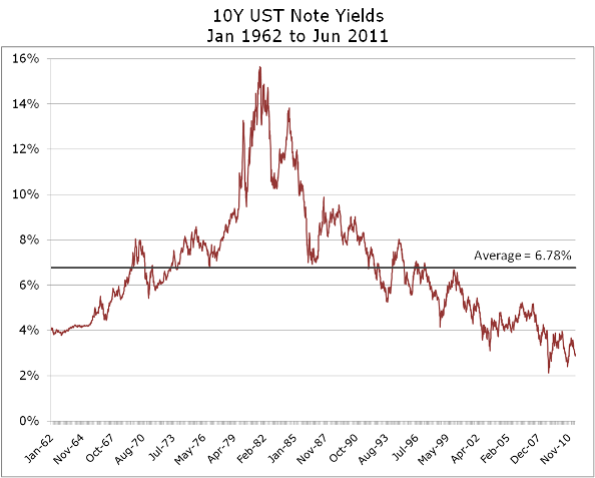
The chart shows UST Note yields starting in January, 1962 up through June 28, 2011. Back in the early 60s when the gold standard imposed some discipline we had yields that are very close to where they are today, though with far less volatility. From there, if you look closely you can see the yield dips associated with these events:
-
the inflation of the Vietnam war when yields first breached 8% (in the modern era)
-
the inflation and oil shocks of '73 and '74
-
the Volcker monetary experiment targeting the money supply in October 1979, wringing out inflation expectations
-
the Mexican peso crisis of 93-94
-
the Russian debt and Long Term Capital episode of 98
-
September 11, 2001, and finally
-
our latest recession in 2008 and the attendant flight to quality
Will a technical or other default on US Treasuries be the next event? Which way will yields go? How does a flight to quality work when the canonical “quality” asset is defaulting? I'm hopeful we won't find out though I'd say the chances are about 50/50 at this point.
Over the next few weeks we’ll put up some posts looking at yield curves more quantitatively and ultimately, how they can inform relative value and borrowing strategies for tax-exempt issuers.
Comments