"Despite its role in...finance, the expectations hypothesis (EH) of the term structure of interest rates has received virtually no empirical support." - Predictions of Short-Term Rates and the Expectations Hypothesis, Federal Reserve Bank of St. Louis
As we've written on these pages before, forecasting is a necessary evil in finance. It's uncertain by nature and of course the longer the horizon, the more difficult the job. The theory that forward rates are good predictors of future realized rates is called the expectations hypothesis and as one MIT professor put it, "If the attractiveness of an economic hypothesis is measured by the number of papers which statistically reject it, the expectations theory of the term structure is a knockout."
For fun (and to dust off my fast fading coding skills) I went back and looked at how US Treasury implied forward 10Y rates have done in forecasting realized 10Y UST yields from July, 1959 to the present. We used first of month data for 3, 6 and 12 month Tbills as zero rates (making the appropriate daycount adjustments of course) and then 2, 3, 5, 7, 10, 20, and 30-year UST coupon instruments for our implied 10Y forward calculations. And this is what we get...
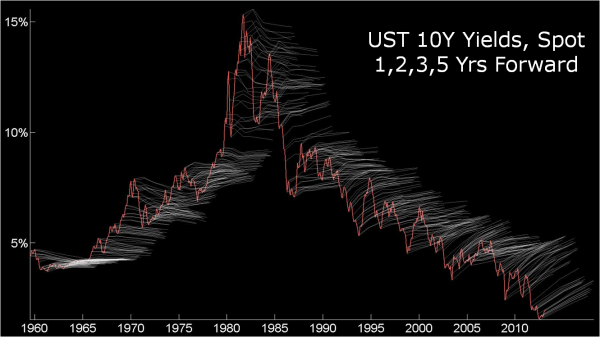
The red line is the actual 10Y yield over the period and the "hair" is the implied 10Y par yield 1, 2, 3, and 5 years forward. The way to read this then is to look at how often the hair tracks with the actual realization of the 10Y yields as shown by the red line. In general, during this single big rate cycle we've seen over the last 50 years, forward rates have badly underpredicted when rates were going up (note the implied decreasing 10Y forwards during the 70s) and then overpredicted over the last 30 or so years as rates have fallen. How badly do forwards do? Well over this 50 year span, and this holds over most subperiods as well, you'd be better off as a forecaster just assuming today's yield curve stays constant i.e. a perfectly random walk.
Let's look at the tax-exempt market. Analyzing today's current tax-exempt yield curve (non-call) we see an implied increase in the curve over 10 years, though we think not in a particularly realistic way. The bottom line in the chart below is the current non-call tax-exempt curve from 1 month out to 30 years (labeled in green).
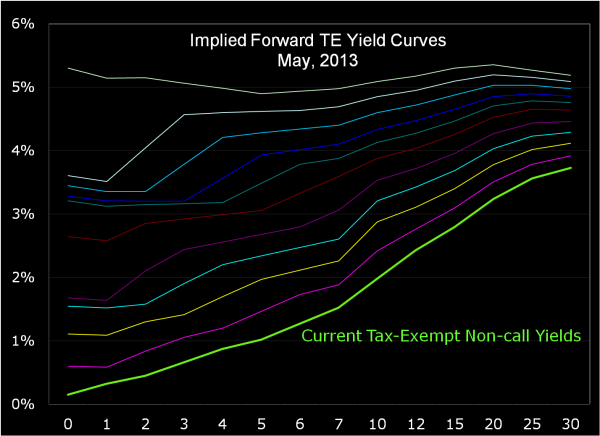
Each successive curve above it is the implied forward yield curve in 1 year forward increments from 1 year through 10. Over the 10 year horizon, you can see the 1 month tax-exempt rate smartly moving up over 500 basis points, equivalent to a 7% slam on the monetary brakes by the Fed. However this is accompanied by only a 1.45% move in the long end of the curve from 3.73% up to 5.18%. Realistic? Perhaps, but we'd expect to probably see a higher 30Y rate if the Fed were really that active over the next 10 years.
Don't get me wrong - if you're in a financial services environment as a trader or you're looking to perform a fair price analysis of an interest rate derivative using an interest rate model, you better use forward rates. If you've got complete and relatively efficient markets, you'll get your head removed if you don't. However, if you're an issuer or working with an issuer looking at some sort of scenario analysis on their debt portfolio, forward rates may be a "good to know" but probably not the end of the forecasting road.
Comments