“I have two ways of learning from history: from the past, by reading the elders; and from the future, thanks to my Monte Carlo toy.”
- Nassim Taleb, Fooled by Randomness
One of the most important and oft-cited metrics we look at in the world of bonds is the yield. And yet, when we look at $1.5 trillion+ unrefunded, fixed-rate, callable municipal bonds, we often are dealing with simply the yield to worst. The “kick” in premium callable bonds is just an artifact of MSRB Rule G-33. But we know that just because an investor survives the first call date, does not mean she atomatically achieves the yield-to-maturity, despite what regulations currently dictate on a holdings statement. This standard simply does not serve the municipal investor community very well.
What do other markets do? For ones that are roughly no-arbitrage (think taxable corporate), we can use standard, 20+ year old option models that do a respectable job. OAS works fine there. For markets with more complex calling behavior than standard option models capture, a prepayment model is used. Assumptions are made about the behavior of the issuer, who obviously owns the right to do what s/he will with the call feature, cash flows are calculated based on this modeled behavior, and then a yield is determined based upon those adjusted cash flows. Can’t we do something like this for the $1.5 trillion+ in callable, unrefunded muni bonds outstanding? At the risk of repeating myself from an article for muni issuers a few weeks back, cars are driving themselves, a machine beat the pants off humans in Jeopardy and is moving on to replacing oncologists, and generally software is eating the world at an accelerating rate. There must be something we can improve on here in the muni market!
Modelling muni callables is hard. First, the municipal bond market simply is not a no-arbitrage environment so standard bond options are at best a round peg in a square hole.1 As Matt Fabian said at a recent MAGNY lunch, the only way to short munis is to not own munis which eliminates the underpinnings of no-arbitrage. And a good model of muni refunding behavior must start with capturing dynamics of two yield curves simultaneously – the issuer’s yields on the refunding bonds but also the treasury market for the reinvestment of proceeds (the escrow). These two markets do not move in lockstep and as such, modeling both of them in a real-world manner is a hard problem. But new research on yield curves allows us to do just that, and perfectly capture the behavior of whatever markets we’re looking at, simultaneously. Don’t believe me? Check for yourself and see if you can identify real vs simulated yield curves; here for Android and here for iOS (iphone/ipad), both free.
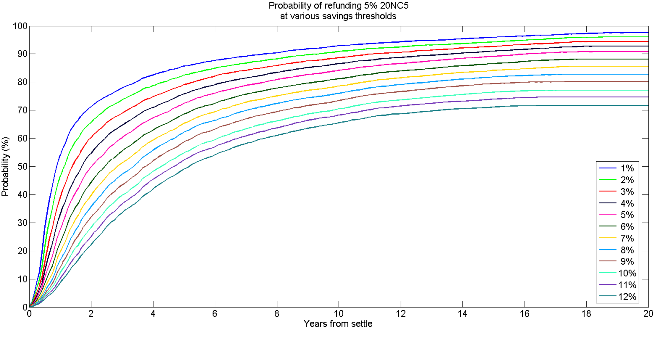
But that’s actually the hard part, and it's done! With that significant threshold crossed and armed with complete simulated yield curves for the issuer and the escrow, we can replicate the calculations issuers use in determining when to refund, in full fidelity. In most cases, this is just a simple present value of cash flow (PV) savings the issuer would receive from refinancing the bond. This allows us to get complete probabilities of refunding, like this for a 5% maturing in 20, callable in 5.
 Note that each line corresponds to a different issuer behavior. The blue line at the top uses 1% PV Savings as the criterion for when the bond is assumed to be refunded. The line at the bottom is 12% PV savings. Intuition serves us as the lower the savings threshold the higher the probability of refunding and vice versa.
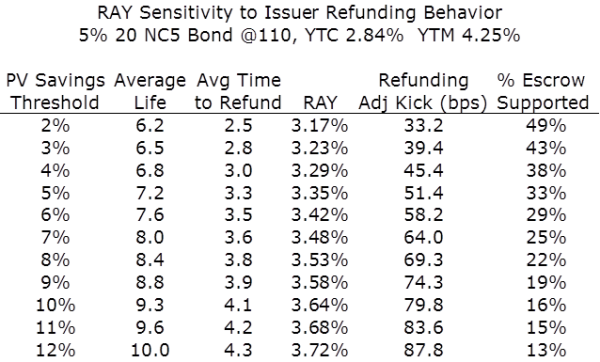
What happens after a refunding, from an investor’s perspective, is also a bit more complex (and I think more interesting) than other markets. Obviously, cash flow is now shortened to the call date. This has implications for the expected cash flows of the bond, its average life, and risk metrics like duration.3 But with new expected cash flows we can calculate a new yield using the bond’s current price– a Refunding Adjusted Yield (RAY) for the investor. This RAY, along with other metrics above, is appropriately sensitive to the refunding behavior of the borrower, as shown in the table below for a 20 year bond, callable in 5 and priced at 110.

Here we have the issuer's refunding behavior changing from 2% PV savings to 12% PV savings in the first column, which changes the Refunding Adjusted (RA) average life in the second. But we also get a statistic that we believe is new and valuable for investors, the average time to refunding. In the 4th column we see the RAY, and again, as we go down the column from most to least aggressive behavior, we get an increasing yield given the cash flows are outstanding for a longer period of time. If we subtract the yield to call of 2.84% from the RAY we get a refunding adjusted kick, a far more accurate metric to use than the standard 1.40% one would get comparing YTC and YTM. And last, this framework allows us to calculate the percentage of the bond’s cash flows expected to be supported by the escrow i.e. are risk-free. And again, as expected this percentage decreases with more conservative refunding behavior. But it’s interesting to note that for the more aggressive refunding, this bond is modeled as essentially half a US Treasury, a fact we think could be very relevant to credit analysts looking at a single bond, or whole portfolio.
One benefit of this framework is it opens a huge door to those muni participants who are in the business of really knowing and comparing muni credits. All of these statistics are impacted by the expected refunding behavior of the issuer, which I think intuition tells us should be the case. RAY shines light on how issuer behavior might impact all of these metrics and ultimately the value of owning municipal bonds.2
I’ll be talking about these muni market innovations and others at the Municipal Analyst Group of NY lunch on next Fri the 13. Hope to see you there!
1 For more detail The Right and Wrong Models for Evaluating Callable Municipal Bonds
2 Additional research forthcoming on refunding behavior.

Comments