(Un)Calculated Risk | by Peter Orr of Intuitive Analytics

Biggest Benefit to Superior Public Finance Analytics? The Questions

Posted by Peter Orr on Nov 23, 2010

When I first started IA a number of years back, I was on the phone late with someone from online banking support trying to resolve an issue with our business account. At one point he asked me to look for an item on the web page which simply wasn't there. He followed up with, "Have you scrolled all the way down to see the entire page?"  Now as I mentioned, this  was late and at the end of a 27 hour day in the early dawn of Intuitive Analytics so this question was not graciously received. My gruff response was approximately, "Now I'm sure asking that is perfectly appropriate and reasonable for many people you find yourself speaking with throughout the day, but for this conversation to be productive, you're going to need to increase the quality of your questions."

Read More

Basel III and the Future of Bank Supported VRDBs in Public Finance

Posted by Peter Orr on Nov 01, 2010

Last Friday I attended the Municipal Analysts Group of New York (MAGNY)'s lunch event on Basel III and the future of the muni variable rate market. First MAGNY event I've been to; it was solid. Chris Wolfe, a Fitch bank analyst, Barbara Samett an analyst from Vanguard, and Bill Collins an MD in public finance at the Bank of Nova Scotia were panelists. 

Basel I was originally designed to set minimum capital levels for banks and create a level playing field for lenders from different countries. Basel I was rather simple and treated a wide range of credit risks with a coarse set of requirements, leading to regulatory arbitrage. It created perverse incentives for banks to load up on more risk increasing expected returns on capital. Basel II provided more granularity to asset classes and went down a more quantitative path allowing banks to use an internal ratings based approach. Unfortunately, Basel II also led to absurd things like 99.9% one year confidence levels. If you think you can reliably capture events that happen once in a thousand years, I've got some watery real estate in the Southeast for you...

 In light of the recent financial crisis and the fact that the once in a thousand year events seem to be occurring every 8-10 years, Basel III (The Return of the Regulators) is upon us. What does this mean for banks and their letter and line of credit products?  Here were the highlights from the discussion:

- Basel III has "scenario based" tests that will generally lead to significantly higher capital charges for banks, decreasing expected RAROC.

- Basel III includes the concept of a "Net Stable Funding Ratio" for which Chris said none of the banks were particularly well-positioned. This may not go fully into effect until 2018.   

Read More

4 Ways to Make Killer Public Finance Debt Service Charts, Part 2

Posted by David De la Nuez on Oct 28, 2010

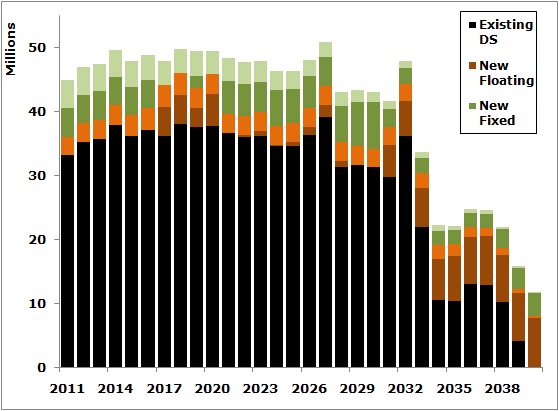
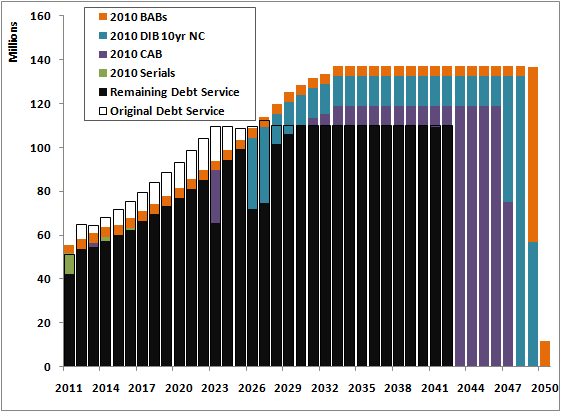
This is a continuation from Part 1 where we showed how to graph debt service and principal prior to the refinancing on the same chart as remaining and new debt service and principal.

Read More

4 Ways to Make Killer Public Finance Debt Service Charts, Part 1

Posted by David De la Nuez on Oct 25, 2010

Debt service charts in public finance are as ubiquitous as business cards at a shortlist presentation and date back to before Lotus 123 offered WYSIWYG. Unfortunately, they usually don’t look much different despite just a few improvements in technology over the last 20+ years. But what can you do to make a principal and interest graph sizzle? The answer is *a bunch of stuff* particularly with Excel 2007's new graphics engine. One rule of thumb (and pet peeve of ours): do not ever make your chart in more dimensions than the data.  Debt service is expressed as amount vs time – two dimensions, not three. Three dimensional bar charts, pie charts, etc. just distort the data you're trying to accurately convey. For more details on this, and definitely if you're not already familiar, read from the master of data visualization, Professor Edward Tufte. But back to debt service…

Read More

Issuers BEWARE: Tax risk is NOT in LIBOR Swaps!

Posted by Peter Orr on Oct 13, 2010

The other day I was perusing the swap notes in the financial statements of a big city I won’t name. In it I found a statement in the section on swaps:

Read More

Want to Get Hired by More Public Finance Issuers? Know Your Position

Posted by Peter Orr on Oct 06, 2010

The first word in our company name means we do a lot more than calc pv savings. We often work with investment banking or financial advisor clients to come up with the clearest way to express complex analyses to tax-exempt issuers. Frequently this leads to crafting ways to convey key messages as part of a broader strategy to get hired.  What often surprises me about these discussions is how little people know about their position. Let me explain

Read More

How Many Refunding Opportunities are You Missing?

Posted by Peter Orr on Aug 19, 2010

With rates this low, how much time and money are you spending running and re-running refunding numbers for your issuer clients and targets? This is an expensive, labor intensive, manual task that is far more accurately, predictably, and cost-effectively done across the department through use of a robust database solution that emails results to the banker, advisor, or issuer.

If you have no idea how much time and money is spent performing these tasks, they likely are costing you way too much. After all, what gets measured gets managed… 
Read More

The Flaw of Averages, Muni Style: SIFMA/LIBOR and Rates

Posted by Peter Orr on Jul 28, 2010

Here’s a quick quiz. If over the last 10 years 1M LIBOR reset weekly averaged 2.814%, and the average of SIFMA / 1M LIBOR was 82.0%, what was the SIFMA average over the same time period (all rates unadjusted for day counts, holidays etc.)?

Read More

Financial Decision Making: 3 Questions Every CFO Must Ask and Answer

Posted by Peter Orr on Jul 20, 2010

Credit markets are certainly not “normal” (in any sense of the
word) but at least they’re stable enough for issuers to make some decisions. That said, keeping in mind the answers to three deceptively simple yet vitally important questions will always serve CFOs, governing boards, finance committees, and other financial decision makers very well.

Read More

Financial Software: Top 10 Reasons Why a Database Kicks a Spreadsheet’s Butt

Posted by Peter Orr on Jul 16, 2010

I’ve always believed there are actually three certainties in life (in contrast to the far less archetypal two): death, taxes, and finance people’ love of spreadsheets.  Spreadsheets are excellent for doing certain types of work given their flexibility. Though frankly, these “electronic chalkboards” as their inventors called them are simply not the right medium for others. For instance, heavy duty simulation based number crunching and optimization shouldn’t be done on a chalkboard, electronic or otherwise. The memory management and numerics simply aren’t suitably industrial strength for big jobs like that. As a data store the spreadsheet also has drawbacks.  Sure it’s flexible and easy to add new bits, but that same flexibility is a problem when it comes to compatibility and consistency, virtues in and of themselves.

Read More